

Power BI: show the amount of a specific value when selected in a column chart
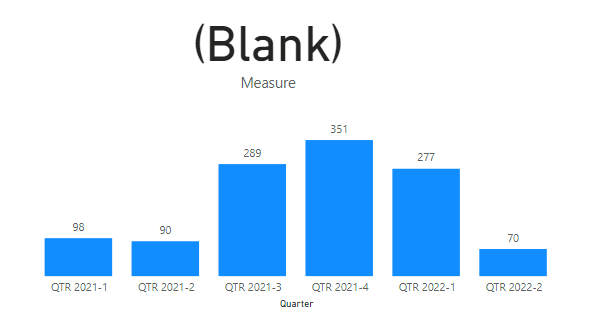
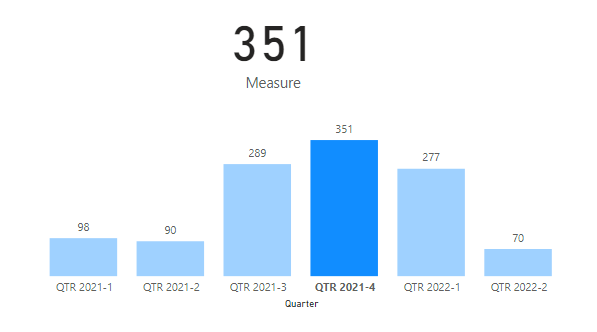
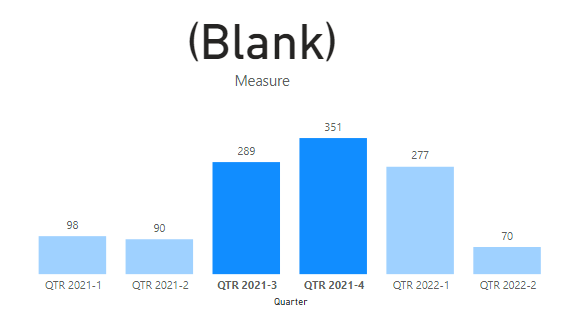
To show the amount of a specific selected value, I have different options. Based on what I want to do, I will use one of them. This DAX formula shows only the value of the specific selected object, it will not show the total or if I select more than one:
CALCULATE(SUM('table'[argument1]),FILTER('table','table'[argument2]=SELECTEDVALUE('table'[argument2])))

To see the result, first I will create a measure by clicking on “home -> new measure” and put the formula. Secondly, I will create a “card” in the visualization and in the “fields”, I put the “measure”.
 |
 |
 |
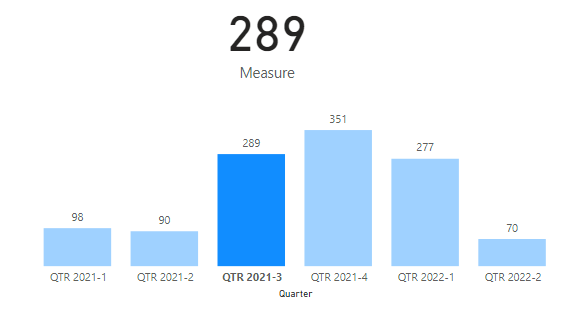
This one will display the same result, the difference is that there is a variable that I can define for a particular object if I want:
var qrtsel=SELECTEDVALUE('table'[argument1])
return CALCULATE(SUM('table'[argument2]),FILTER('table','table'[argument1]=qrtsel))

In this example, I only show 1 chart but imagine that I have 2 charts, one with “axis = quarter” ('trend'[Quarter]) and the other one with “axis = month” ('trend'[Month]). If I select something in the month chart, it will not interfere with the quarter one.
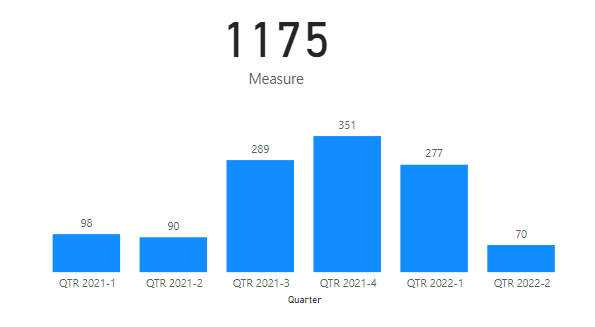
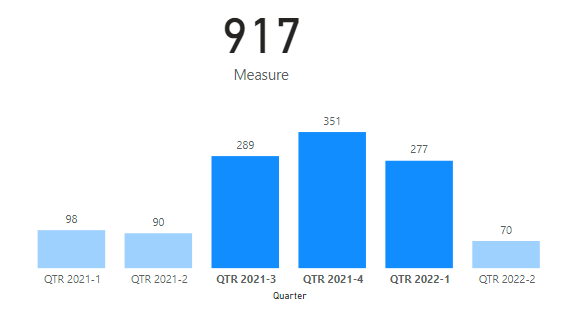
This DAX formula will show the value no matter what I will select or not:
IF(HASONEVALUE('table'[argument1]),CALCULATE(SUM('table'[argument2]),FILTER('table','table'[argument1]=
SELECTEDVALUE('table'[argument1]))),SUM('table'[argument2]))

 |
 |
 |
Interesting Management
-

Part 1: A good manager, better team motivation, better team productivity, better team results
When you are managing a team, “how to be a good manager” is the “must”...
-

Report optimization, increase your time management
As manager, I am doing many reports, even when I was an ITIL consultant, I still needed to do many reports...
-

Tools to get your ITIL intermediate certifications, the missing 15 points for the ITIL 4 Managing Professional
ITIL V3 is going to be obsolete...
-

The importance of the first customer meeting for the service
Managing an IT service when I start a new company is not an easy task, particularly true, if the service...
-

1 click macro tool: Incident/Problem Management - create a daily report in excel
This file will allow you to have in one single excel file the issues (incidents, problems, outages, major incidents...
-
1 click macro tool: Incident/Problem Management - create a daily report and a public version in excel
This file is an extended version of the above that includes the option to create a public version to share with...
-
1 click macro tool: Problem/Incident Management - compile multiple daily excel files in 1 with access
This file will allow you to compile all daily issues reported in excel in 1 single excel file in xlsx format...
-
1 click macro tool: Incident/Problem Management - create a monthly report in excel
This file will allow you to create a monthly report related to daily issues and updating all pivots, charts and...
-
1 click macro tool: Problem/Incident Management - create daily reports and compile them in 1 to create the monthly report in excel
This tool will create daily reports then compile them to create the monthly...
-

Calculate a weighted average for a SLA and a conversation time with a formula in an excel report
In one of my experiences, I had a tool that gave me the weighted average...
-
Search in different sheets then display the wanted data with a formula in an excel report
vlookup and hlookup are formulas that allow to search a data in another...
-
Find the good data by matching 3 different criterias with a formula in an excel report
It is a combination of “index” and “match” formulas, much better...
-
Sum and count sales with a formula in an excel report
Extracting data from salesforce or qlikview may not give the information I needed, it already happened...
-
Know how long a service is impacted with a formula in an excel report
It is important to know how long the service has been impacted by...