

ServiceNow: indicator to define my chart for a report management
Indicators define a performance measurement taken at regular intervals of a business service, an activity, or organizational behavior. It collects data to monitor controls and risks, and collect audit evidence. To resume, it will allow me to control how I want to create and to display my charts.
To get better details, I need to link my indicator with a breakdown, if I don’t do that, I just get an overall view. For instance, a total number of resolved problem tickets by workgroup (indicator with breakdown) and a total number of resolved problem tickets (indicator without breakdown). To know more about breakdowns, read ServiceNow: breakdown to group/filter data for a report Management.
Amongst the indicator, there are formula indicators. Those formula ones are very useful, above all, to calculate the resolution rate for instance so with those kind of indicators, I can get more results to be displayed into a chart. To know more about formula indicators, read ServiceNow: formula indicator to define my chart for a report management. To create an indicator, follow those steps:
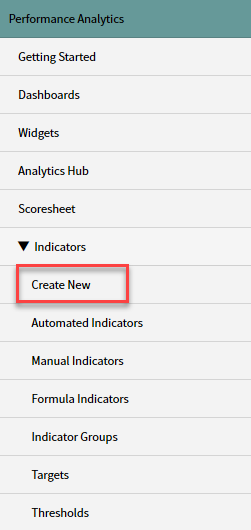
- 1. Go to “performance analytics -> indicators -> create new”
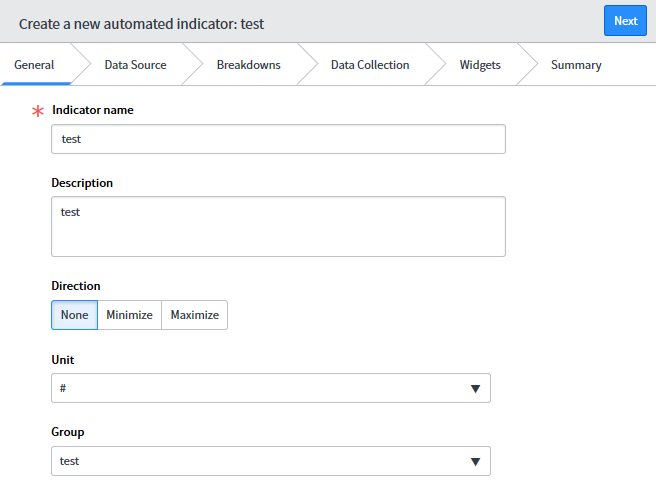
a. In the “general” view
- i. Indicator name: put a name
- ii. Description: put a description
- iii. Direction: select the needed option
NOTE: minimize to display larger tiles for large value and maximize is the opposite. For example, the goal of risk is to minimize the risk, so minimize will be selected so that higher risk scores appear more prominently in larger tiles. - iv. Unit: select number, percentage, etc about how I want to display the data
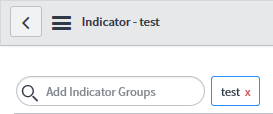
- v. Group: if I have an indicator group, I put its name here so this indicator will put inside the group
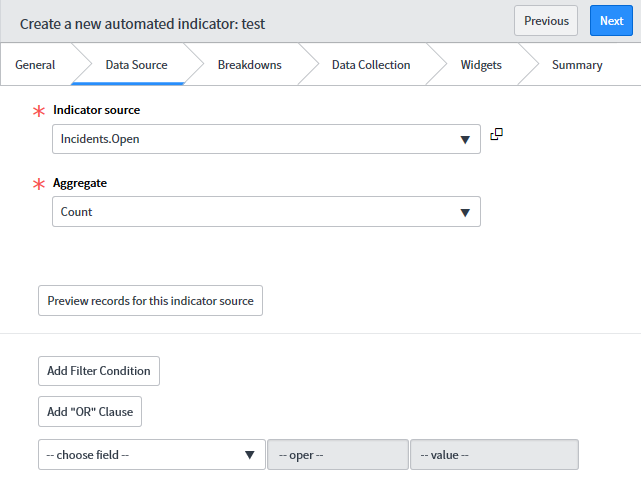
b. In the “data source” view
- i. Indicator source: select the source
- ii. Aggregate: select how to value the data (count, sum, etc.)
- iii. Filtering options will appear only based of the indicator source
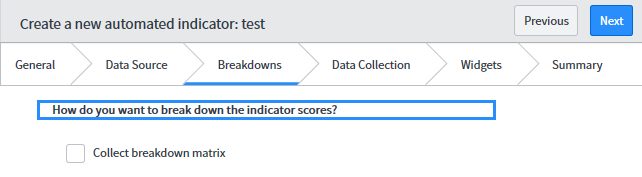
- i. Breakdown options will appear only based of the indicator source
1. If none, create one and linked to it
2. If some, select breakdowns to link to this indicator
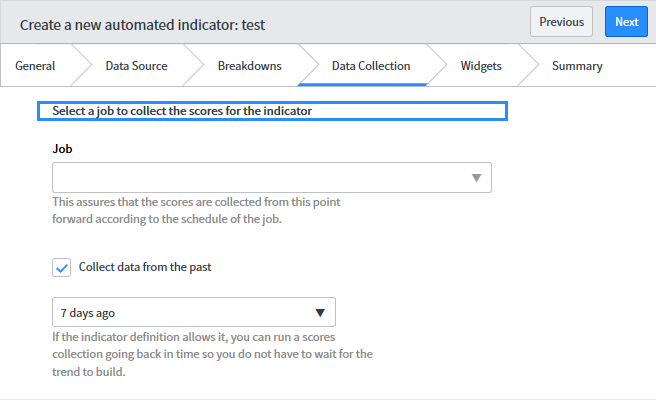
d. In the “data collection” view
- i. Job: select the job
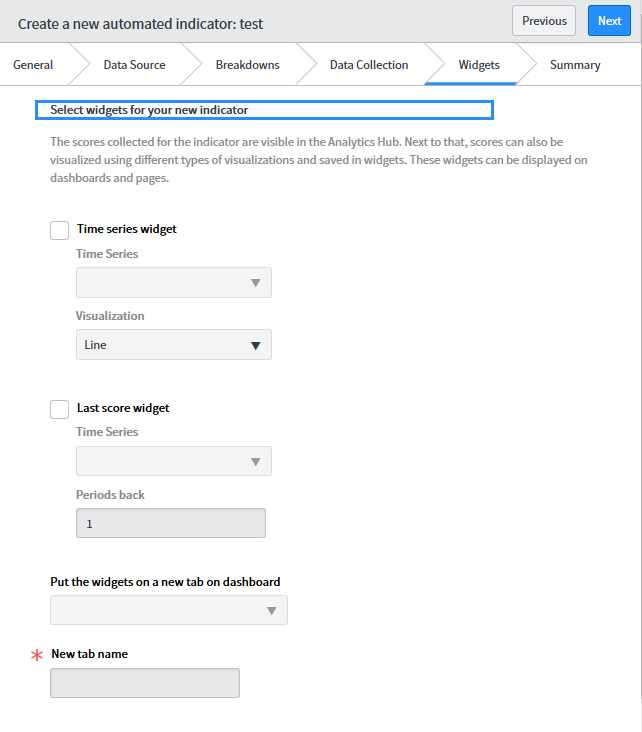
e. In the “widgets” view
- i. Time series widget: if I want my chart to show daily, weekly, monthly or yearly, select this option
- ii. Last score widget: if I want my chart to show numbers, percentage, etc, select this option
- iii. Put the widgets on a new tab on dashboard: put the dashboard name where I want to have this indicator
- iv. New tab name: put a name
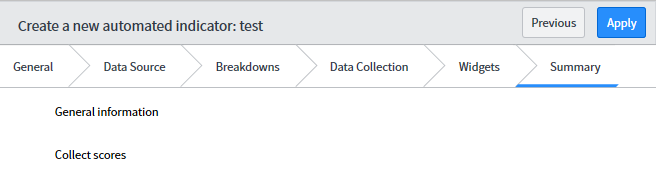
f. In the “summary” view
- i. Just displaying a resume:
1. If I am satisfy, click “apply”
2. If I am not, I can click directly in the view where I want to change
- 2. Now do one of the 2 options:
a. If not into an indicator group, go to “performance analytics -> indicators -> automated indicators”
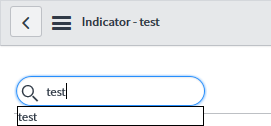
- i. Search for the indicator
- ii. Open it to fill the other optional fields not displaying during the creation
- iii. Click “update” if I do some changes
b. If into an indicator group, go to “performance analytics -> indicators -> indicator groups”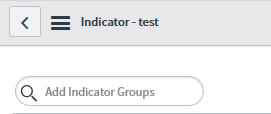
- i. Search for the group where I put the indicator
- ii. Search for the indicator
- iii. Open it to fill the other optional fields not displaying during the creation
- iv. Click “update” if I do some changes
Interesting Management
-

Part 1: A good manager, better team motivation, better team productivity, better team results
When you are managing a team, “how to be a good manager” is the “must”...
-

Report optimization, increase your time management
As manager, I am doing many reports, even when I was an ITIL consultant, I still needed to do many reports...
-

Tools to get your ITIL intermediate certifications, the missing 15 points for the ITIL 4 Managing Professional
ITIL V3 is going to be obsolete...
-

The importance of the first customer meeting for the service
Managing an IT service when I start a new company is not an easy task, particularly true, if the service...
-

1 click macro tool: Incident/Problem Management - create a daily report in excel
This file will allow you to have in one single excel file the issues (incidents, problems, outages, major incidents...
-
1 click macro tool: Incident/Problem Management - create a daily report and a public version in excel
This file is an extended version of the above that includes the option to create a public version to share with...
-
1 click macro tool: Problem/Incident Management - compile multiple daily excel files in 1 with access
This file will allow you to compile all daily issues reported in excel in 1 single excel file in xlsx format...
-
1 click macro tool: Incident/Problem Management - create a monthly report in excel
This file will allow you to create a monthly report related to daily issues and updating all pivots, charts and...
-
1 click macro tool: Problem/Incident Management - create daily reports and compile them in 1 to create the monthly report in excel
This tool will create daily reports then compile them to create the monthly...
-

Calculate a weighted average for a SLA and a conversation time with a formula in an excel report
In one of my experiences, I had a tool that gave me the weighted average...
-
Search in different sheets then display the wanted data with a formula in an excel report
vlookup and hlookup are formulas that allow to search a data in another...
-
Find the good data by matching 3 different criterias with a formula in an excel report
It is a combination of “index” and “match” formulas, much better...
-
Sum and count sales with a formula in an excel report
Extracting data from salesforce or qlikview may not give the information I needed, it already happened...
-
Know how long a service is impacted with a formula in an excel report
It is important to know how long the service has been impacted by...