

ServiceNow: reports vs widgets for a report management
One of the good things of ServiceNow is that the tool allows to create charts and tables for my monthly report, in such case, I don’t need to extract the data into excel and to do everything with excel. Of course, it doesn’t mean that I stopped to use excel but for some simple charts, it is easier and better to use the reporting function of this tool management.
The tool offers me 2 ways, the report function or the widget function. I don’t have a preference since I am using both depending of the type of reports but if I have to choose which one is better, I will say “report”.
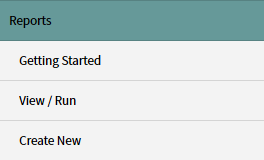
“Reports” is easy to use, by just few clicks and in few minutes I can create a chart, a pivot table or a listing. I don’t have to think about it, just giving a name, selecting the database to get the results then selecting the type of charts and doing some configuration to personalize it, and I am done. Optionally, I can configure to get the reports automatically by email in excel or pdf file for instance.
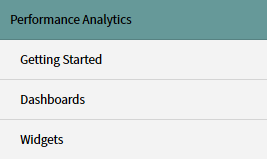
“Widgets” is not the contrary but almost. It is not so simple because a widget is pulling the result from an indicator and if I want to do some filtering, I need to create a breakdown. To resume, a widget is nothing without an indicator so first, I have to create an indicator and if I want to get deeper details, I have also to create a breakdown linked to this indicator. Once I have it, I can create a widget that will be associated with this indicator. As you can see, it is not as friendly as “reports”.
“Widgets” is more powerful than “reports” because it offers more options so if I can’t get what I want from “reports”, I will create a widget and if I can’t get what I need from “widgets”, I just extract the data and I will work with excel.
The purpose for me if I am working in a project in which the company uses ServiceNow, I will try to get all the needed reports from this tool because it will save me a lot of time. To know more about “reports”, read ServiceNow: create reports for a report management and for “widgets”, read ServiceNow: widget to create a chart for a report management.
Interesting Management
-

Part 1: A good manager, better team motivation, better team productivity, better team results
When you are managing a team, “how to be a good manager” is the “must”...
-

Report optimization, increase your time management
As manager, I am doing many reports, even when I was an ITIL consultant, I still needed to do many reports...
-

Tools to get your ITIL intermediate certifications, the missing 15 points for the ITIL 4 Managing Professional
ITIL V3 is going to be obsolete...
-

The importance of the first customer meeting for the service
Managing an IT service when I start a new company is not an easy task, particularly true, if the service...
-

1 click macro tool: Incident/Problem Management - create a daily report in excel
This file will allow you to have in one single excel file the issues (incidents, problems, outages, major incidents...
-
1 click macro tool: Incident/Problem Management - create a daily report and a public version in excel
This file is an extended version of the above that includes the option to create a public version to share with...
-
1 click macro tool: Problem/Incident Management - compile multiple daily excel files in 1 with access
This file will allow you to compile all daily issues reported in excel in 1 single excel file in xlsx format...
-
1 click macro tool: Incident/Problem Management - create a monthly report in excel
This file will allow you to create a monthly report related to daily issues and updating all pivots, charts and...
-
1 click macro tool: Problem/Incident Management - create daily reports and compile them in 1 to create the monthly report in excel
This tool will create daily reports then compile them to create the monthly...
-

Calculate a weighted average for a SLA and a conversation time with a formula in an excel report
In one of my experiences, I had a tool that gave me the weighted average...
-
Search in different sheets then display the wanted data with a formula in an excel report
vlookup and hlookup are formulas that allow to search a data in another...
-
Find the good data by matching 3 different criterias with a formula in an excel report
It is a combination of “index” and “match” formulas, much better...
-
Sum and count sales with a formula in an excel report
Extracting data from salesforce or qlikview may not give the information I needed, it already happened...
-
Know how long a service is impacted with a formula in an excel report
It is important to know how long the service has been impacted by...