Power BI: create an automatically updated calendar
The year of this calendar will be updated automatically, it is quite useful so there is no need to change it manually every year. The calendar can be the last 12 months, or between another and current year. To do that, I will create a calculated table (DAX table) by going to the “data view” then select “new table”:

Put this formula:
var FullCalendar = ADDCOLUMNS(CALENDAR(YEAR(NOW())-1&"/1/1",YEAR(NOW())&"/12/31"),
"calendar",[Date],"month",FORMAT([Date],"YYYY-MM"))
return
SUMMARIZE(FullCalendar,[calendar],[month])
It will create a calendar:
- from the full last year: YEAR(NOW())-1
- to the full current year: YEAR(NOW())
If you want more past years, just change “1” by another number. In the picture, I changed the table name from “table” to “calendar”:

Once done, I can add new columns by clicking on “new column” to display the quarter and/or the year by putting this formula:
- for the quarter: FORMAT([argument],"\QTR-YYYY-Q")

- for the year: FORMAT([argument],"YYYY")

NOTE: change “argument” by the name of your column. If I don’t want to add new columns, the other option is to put what I need in my calendar formula:

If I want to show only the last 12 months, I will use this formula:
var FullCalendar = ADDCOLUMNS(CALENDAR(YEAR(NOW())-1&"/"&MONTH(NOW())&"/"&DAY(NOW()),
YEAR(NOW())&"/"&MONTH(NOW())&"/"&DAY(NOW())),
"calendar",[Date],"month",FORMAT([Date],"YYYY-MM"))
return
SUMMARIZE(FullCalendar,[calendar],[month])

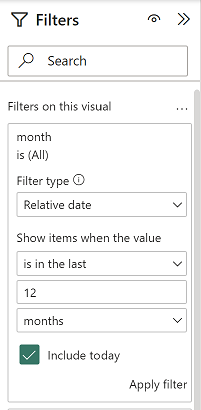
When I will create a chart, I just have to configure the filter like that:

Don’t forget to click on “apply filter” to apply the change.
Interesting Management
-

Part 1: A good manager, better team motivation, better team productivity, better team results
When you are managing a team, “how to be a good manager” is the “must”...
-

Report optimization, increase your time management
As manager, I am doing many reports, even when I was an ITIL consultant, I still needed to do many reports...
-

Tools to get your ITIL intermediate certifications, the missing 15 points for the ITIL 4 Managing Professional
ITIL V3 is going to be obsolete...
-

The importance of the first customer meeting for the service
Managing an IT service when I start a new company is not an easy task, particularly true, if the service...


