

Power BI: cumulative total values
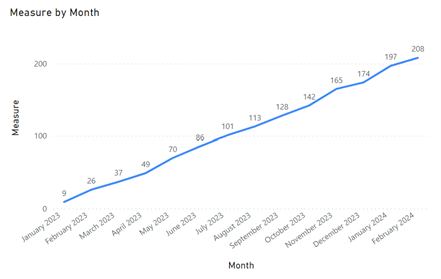
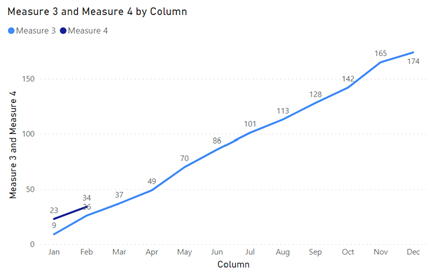
I will explain different ways to do a cumulative value including the WINDOW function because based on the database, one will work better than the others. This is an example of the cumulative total result:
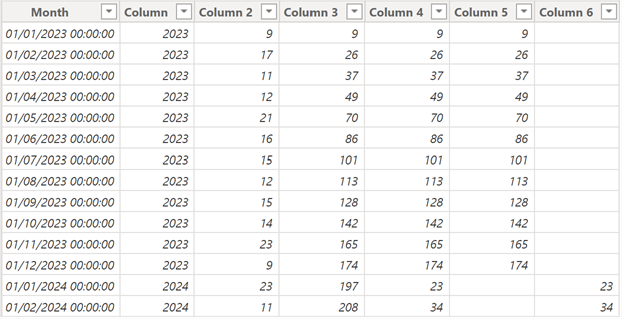
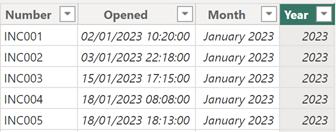
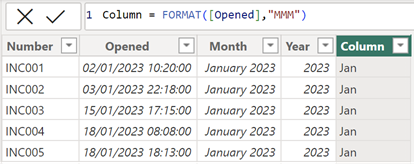
I have this original data in Table1:
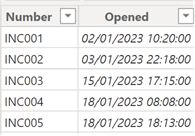
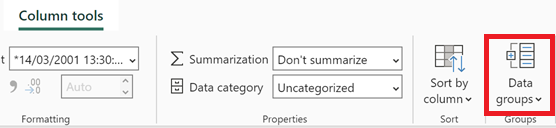
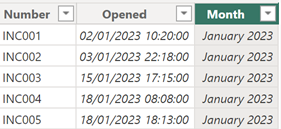
The “opened” column has duplicate values so I have to extract the unique ones but first, I will grouped the date by month:
 |
 |
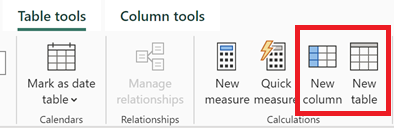
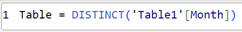
Using this “month” column, I will export the unique values by creating a new DAX table:
 |
 |
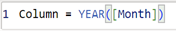
With this new table, I will add a “year” column using this formula:
I will count all incidents per month using this formula:
CALCULATE(COUNT('table1'[argument1]),FILTER('table1','table1'[argument2]='Table2'[argument2]))

NOTE:
- Replace “table” and “argument” by yours
- I can use COUNTROWS instead of COUNT
This formula will do the cumulative sum:
CALCULATE(SUM('table'[argument1]),ALL('table'),'table'[argument2]<=EARLIER('table'[argument2]))

To do the cumulative by year, I will use this formula:
CALCULATE(SUM('table'[argument1]),ALL('table'),'table'[argument2]<=EARLIER('table'[argument2]) && 'table'[argument3]=EARLIER('table'[argument3]))

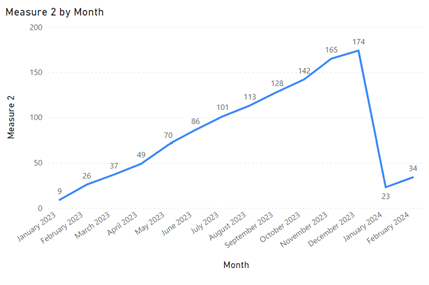
To show only the last year:
IF('table'[argument3]=YEAR(NOW())-1,CALCULATE(SUM('table'[argument1]),ALL('table'),'table'[argument2]<=EARLIER('table'[argument2]) && 'table'[argument3]=EARLIER('table'[argument3])))

To show only the current year:
IF('table'[argument3]=YEAR(NOW()),CALCULATE(SUM('table'[argument1]),ALL('table'),'table'[argument2]<=EARLIER('table'[argument2]) && 'table'[argument3]=EARLIER('table'[argument3])))

Instead to use calculated columns, I can get the same result by using only measures. In this case, I will only use my original table Table1. I will add a “year” column using the same method as I did for the “month” one:
The measure for the continuous cumulative sum:
CALCULATE(COUNT('table'[argument1]),FILTER(ALL('table'),'table'[argument2]<=MAX('table'[argument2])))

The measure by year:
CALCULATE(COUNT('table'[argument1]),FILTER(ALL('table'),'table'[argument2]<=MAX('table'[argument2]) && 'table'[argument3]=MAX('table'[argument3])))

The measure for the last year:
CALCULATE(CALCULATE(COUNT('table'[argument1]),FILTER(ALL('table'),'table'[argument2]<=MAX('table'[argument2]) && 'table'[argument3]=MAX('table'[argument3]))),YEAR('table'[argument3])=YEAR(NOW())-1)

The measure for the current year:
CALCULATE(CALCULATE(COUNT('table'[argument1]),FILTER(ALL('table'),'table'[argument2]<=MAX('table'[argument2]) && 'table'[argument3]=MAX('table'[argument3]))),YEAR('table'[argument3])=YEAR(NOW()))

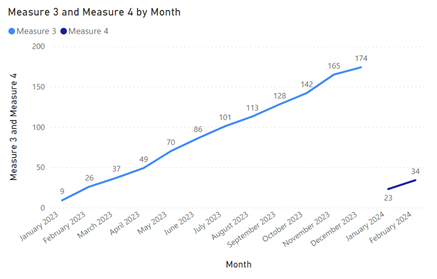
To layer the last and current years for a comparison, I will need to add a new column:
And for the visual, I will use this new column then sorting the axis by ascending:
Before to close this topic, I will talk about the WINDOW function. Based on my data, I will use one of those 2 formulas to create a measure:
- If my data has a column with numbers like the new table:
CALCULATE(SUM('table'[argument1]),WINDOW(1,ABS,0,REL,ALL('table'),ORDERBY('table'[argument2])))

- If my data hasn’t this column like the original table:
CALCULATE(COUNT('table'[argument1]),WINDOW(1,ABS,0,REL,ALL('table'),ORDERBY('table'[argument2])))

The only difference is only for the “argument1”, one uses SUM and the other COUNT so for my following explanations, I will just use the COUNT formula to not repeat the same thing.
IMPORTANT: the WINDOW function works better with an original data with unique values. In my example, my original data Table1 has duplicate values including the new table because it has been created from it by excluding them.
So putting the formula, I will get a duplicate row error (I will get the same thing with the new table using SUM):

As I said before, if the original data has unique values, this error will not appear. There are 2 options to solve it:
- Option 1: replace ALL('table') by DISTINCT(ALLSELECTED('table'))
CALCULATE(COUNT('table'[argument1]),WINDOW(1,ABS,0,REL,DISTINCT(ALLSELECTED('table')),
ORDERBY('table'[argument2])))

- Option 2: add MATCHBY
CALCULATE(COUNT('table'[argument1]),WINDOW(1,ABS,0,REL,ALL('table'),ORDERBY('table'[argument2]),,,
MATCHBY('table'[argument2])))

NOTE:
- In spite that the duplicate error disappears, MATCHBY may not work in visual, particularly with COUNT
- DISTINCT will take longer for a huge data
Now that I explain how to resolve the duplicate errors, for the following explanations, let’s imagine that my table has unique values and no duplicates. For the measure by year, I will have to add PARTITIONBY:
CALCULATE(COUNT('table'[argument1]),WINDOW(1,ABS,0,REL,ALL('table'),ORDERBY('table'[argument2]),,
PARTITIONBY('table'[argument3])))

NOTE: PARTITIONBY is just before MATCHBY

The measure for the last year:
CALCULATE(CALCULATE(COUNT('table'[argument1]),YEAR('table'[argument2])=YEAR(NOW())-1),
WINDOW(1,ABS,0,REL,ALL('table'),ORDERBY('table'[argument3]),,PARTITIONBY('table'[argument4])))

The measure for the current year:
CALCULATE(CALCULATE(COUNT('table'[argument1]),YEAR('table'[argument2])=YEAR(NOW())),
WINDOW(1,ABS,0,REL,ALL('table'),ORDERBY('table'[argument3]),,PARTITIONBY('table'[argument4])))

NOTE:
- I don’t use the “month” column to reference the year because I need the original column which is “opened”
- Some functions like ALL, USERELATIONSHIP, etc. work better after the WINDOW function
For ORDERBY, PARTITIONBY and MATCHBY, I can add other criteria by adding a coma just after the argument, for instance: ORDERBY('table'[argument2],new criteria1,new criteria2,etc)
Interesting Management
-

Part 1: A good manager, better team motivation, better team productivity, better team results
When you are managing a team, “how to be a good manager” is the “must”...
-

Report optimization, increase your time management
As manager, I am doing many reports, even when I was an ITIL consultant, I still needed to do many reports...
-

Tools to get your ITIL intermediate certifications, the missing 15 points for the ITIL 4 Managing Professional
ITIL V3 is going to be obsolete...
-

The importance of the first customer meeting for the service
Managing an IT service when I start a new company is not an easy task, particularly true, if the service...
-

1 click macro tool: Incident/Problem Management - create a daily report in excel
This file will allow you to have in one single excel file the issues (incidents, problems, outages, major incidents...
-
1 click macro tool: Incident/Problem Management - create a daily report and a public version in excel
This file is an extended version of the above that includes the option to create a public version to share with...
-
1 click macro tool: Problem/Incident Management - compile multiple daily excel files in 1 with access
This file will allow you to compile all daily issues reported in excel in 1 single excel file in xlsx format...
-
1 click macro tool: Incident/Problem Management - create a monthly report in excel
This file will allow you to create a monthly report related to daily issues and updating all pivots, charts and...
-
1 click macro tool: Problem/Incident Management - create daily reports and compile them in 1 to create the monthly report in excel
This tool will create daily reports then compile them to create the monthly...
-

Calculate a weighted average for a SLA and a conversation time with a formula in an excel report
In one of my experiences, I had a tool that gave me the weighted average...
-
Search in different sheets then display the wanted data with a formula in an excel report
vlookup and hlookup are formulas that allow to search a data in another...
-
Find the good data by matching 3 different criterias with a formula in an excel report
It is a combination of “index” and “match” formulas, much better...
-
Sum and count sales with a formula in an excel report
Extracting data from salesforce or qlikview may not give the information I needed, it already happened...
-
Know how long a service is impacted with a formula in an excel report
It is important to know how long the service has been impacted by...