

Power BI: calculate values of a single column by cell
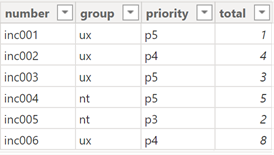
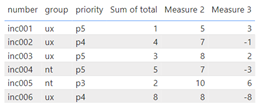
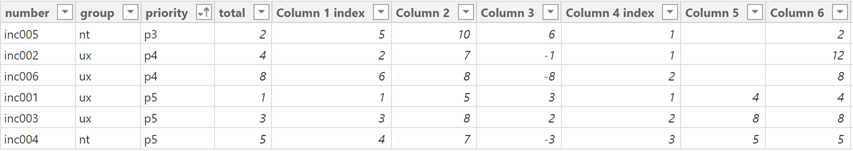
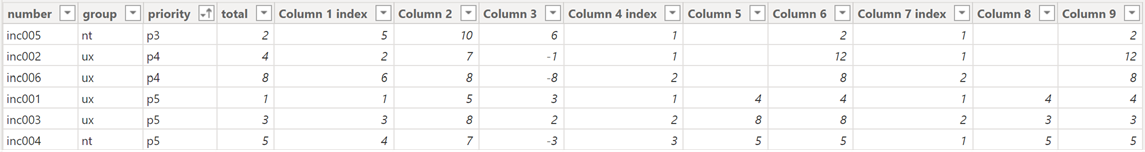
To calculate the values of each cell of a single column, I will have first to tell Power BI to look for the value of the next cell then do a sum or a subtract of the current cell with it by using an index/rank column. I will explain how to do it for a general data then grouped by 1 or multiple conditions. Let´s take an example with this simple data:
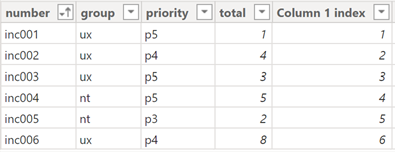
First I will create a simple index column for the whole data with this formula and named it that way:
RANKX(ALL('table'),'table'[argument],,ASC) // to sort descending replace ASC by DESC

NOTE:
- Replace “table” and “argument” by yours
- I am using my “number” column to sort ascending instead of a “date” column, “name” column, etc.
- The index can be created in the Power Query Editor (not the purpose here) but when you have a huge data, it won´t work properly
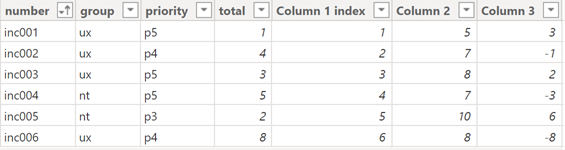
With the index, I will be able to sum each cell with this formula:
var nextrow = 'table'[argument1]+1
var valuenextrow = CALCULATE(VALUES('table'[argument2]),FILTER(ALL('table'),'table'[argument1]=nextrow))
return
CALCULATE(VALUES('table'[argument2])) + valuenextrow // to subtract use this (column 3): valuenextrow - CALCULATE(VALUES('table'[argument2]))

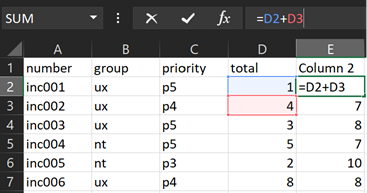
This is the result and the picture on the right, it is just to illustrate my meaning:
 |
 |
NOTE: if you don’t want to use an index and based on your needs, you can get the same result using the OFFSET and/or WINDOW functions (more simple, read this article Power BI: calculate values of a single column by row).
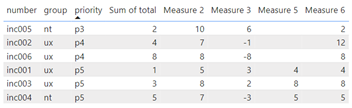
Instead to use a calculated column, I can use a measure. In this case, the formula will be a little different but quite similar:
var nextrow = MIN('table'[argument1])+1
var valuenextrow = CALCULATE(MIN('table'[argument2]),FILTER(ALL('table'),'table'[argument1]=nextrow))
return
CALCULATE(MIN('table'[argument2])) + valuenextrow // to subtract use this (measure 3): valuenextrow - CALCULATE(MIN('table'[argument2]))

Now, let´s say that I want to do that for a particular group (for instance priority). As for the general one, I have to create an index for each priority with this formula:
RANKX(FILTER('table','table'[argument]=EARLIER('table'[argument])),'table'[number],,ASC)

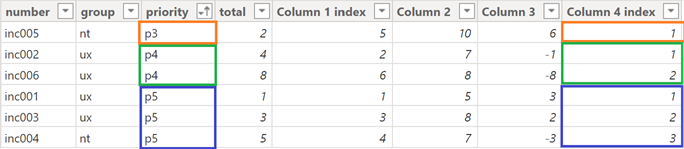
I will start first to calculate for “p5” with this formula:
var nextrow = 'table'[argument1]+1
var valuenextp5 = CALCULATE(VALUES('table'[argument2]),FILTER(ALL('table'),'table'[argument1]=nextrow && 'table'[argument3]="value"))
return
IF([argument3]="value",CALCULATE(VALUES('table'[argument2])) + valuenextp5,BLANK())

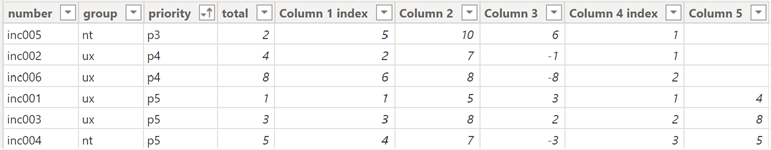
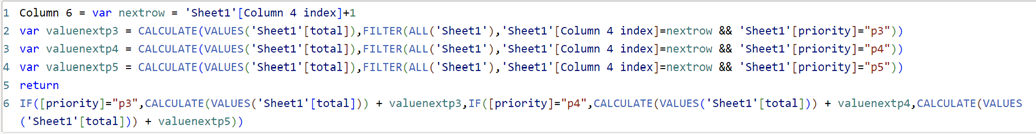
If I want to complete the column with the other priorities, just repeat the same formula as “p5” like that:
var nextrow = 'table'[argument1]+1
var valuenextp3 = CALCULATE(VALUES('table'[argument2]),FILTER(ALL('table'),'table'[argument1]=nextrow && 'table'[argument3]="value1"))
var valuenextp4 = CALCULATE(VALUES('table'[argument2]),FILTER(ALL('table'),'table'[argument1]=nextrow && 'table'[argument3]="value2"))
var valuenextp5 = CALCULATE(VALUES('table'[argument2]),FILTER(ALL('table'),'table'[argument1]=nextrow && 'table'[argument3]="value3"))
return
IF([argument3]="value1",CALCULATE(VALUES('table'[argument2])) + valuenextp3,IF([argument3]="value2",CALCULATE(VALUES('table'[argument2])) + valuenextp4,CALCULATE(VALUES('table'[argument2])) + valuenextp5))
I will explain the measure formula for the column 5 because the measure for the column 6 has the same logic:
var nextrow = MIN('table'[argument1])+1
var valuenextp5 = CALCULATE(MIN('table'[argument2]),FILTER(ALL('table'),'table'[argument1]=nextrow && 'table'[argument3]="value"))
return
IF(MIN('table'[argument3])="value",CALCULATE(MIN('table'[argument2])) + valuenextp5,BLANK())

I will complicate a little more, calculating a group of 2 criterias (“group” and “priority”) so again, I will need to create a new index for this group of 2 conditions:
RANKX(FILTER('table','table'[argument1]=EARLIER('table'[argument1]) && 'table'[argument2]=EARLIER('table'[argument2])),'table'[argument3],,ASC)

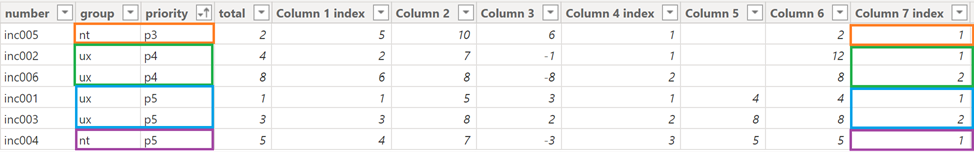
NOTE: if I need to group more sub-categories, I just need to add another “&& 'table'[argument3]=EARLIER('table'[argument3])”, etc.
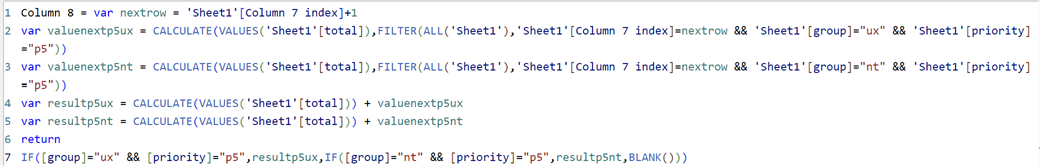
The calculation formula (for the column 9 has the same logic):
var nextrow = 'table'[argument1]+1
var valuenextp5ux = CALCULATE(VALUES('table'[argument2]),FILTER(ALL('table'),'table'[argument1]=nextrow && 'table'[argument3]="value1" && 'table'[argument4]="value2"))
var valuenextp5nt = CALCULATE(VALUES('table'[argument2]),FILTER(ALL('table'),'table'[argument1]=nextrow && 'table'[argument3]="value3" && 'table'[argument4]="value2"))
var resultp5ux = CALCULATE(VALUES('table'[argument2])) + valuenextp5ux
var resultp5nt = CALCULATE(VALUES('table'[argument2])) + valuenextp5nt
return
IF([argument3]="value1" && [argument4]="value2",resultp5ux,IF([argument3]="value3" && [argument4]="value2",resultp5nt,BLANK()))
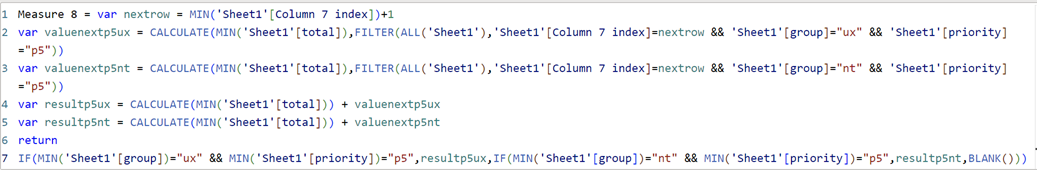
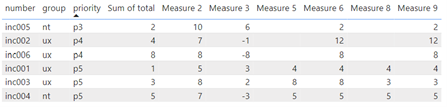
And I will end with the measure (just repeat the same logic for the measure 9):
var nextrow = MIN('table'[argument1])+1
var valuenextp5ux = CALCULATE(MIN('table'[argument2]),FILTER(ALL('table'),'table'[argument1]=nextrow && 'table'[argument3]="value1" && 'table'[argument4]="value2"))
var valuenextp5nt = CALCULATE(MIN('table'[argument2]),FILTER(ALL('table'),'table'[argument1]=nextrow && 'table'[argument3]="value3" && 'table'[argument4]="value2"))
var resultp5ux = CALCULATE(MIN('table'[argument2])) + valuenextp5ux
var resultp5nt = CALCULATE(MIN('table'[argument2])) + valuenextp5nt
return
IF(MIN('table'[argument3])="value1" && MIN('table'[argument4])="value2",resultp5ux,IF(MIN('table'[argument3])="value3" && MIN('table'[argument4])="value2",resultp5nt,BLANK()))
Interesting Management
-

Part 1: A good manager, better team motivation, better team productivity, better team results
When you are managing a team, “how to be a good manager” is the “must”...
-

Report optimization, increase your time management
As manager, I am doing many reports, even when I was an ITIL consultant, I still needed to do many reports...
-

Tools to get your ITIL intermediate certifications, the missing 15 points for the ITIL 4 Managing Professional
ITIL V3 is going to be obsolete...
-

The importance of the first customer meeting for the service
Managing an IT service when I start a new company is not an easy task, particularly true, if the service...
-

1 click macro tool: Incident/Problem Management - create a daily report in excel
This file will allow you to have in one single excel file the issues (incidents, problems, outages, major incidents...
-
1 click macro tool: Incident/Problem Management - create a daily report and a public version in excel
This file is an extended version of the above that includes the option to create a public version to share with...
-
1 click macro tool: Problem/Incident Management - compile multiple daily excel files in 1 with access
This file will allow you to compile all daily issues reported in excel in 1 single excel file in xlsx format...
-
1 click macro tool: Incident/Problem Management - create a monthly report in excel
This file will allow you to create a monthly report related to daily issues and updating all pivots, charts and...
-
1 click macro tool: Problem/Incident Management - create daily reports and compile them in 1 to create the monthly report in excel
This tool will create daily reports then compile them to create the monthly...
-

Calculate a weighted average for a SLA and a conversation time with a formula in an excel report
In one of my experiences, I had a tool that gave me the weighted average...
-
Search in different sheets then display the wanted data with a formula in an excel report
vlookup and hlookup are formulas that allow to search a data in another...
-
Find the good data by matching 3 different criterias with a formula in an excel report
It is a combination of “index” and “match” formulas, much better...
-
Sum and count sales with a formula in an excel report
Extracting data from salesforce or qlikview may not give the information I needed, it already happened...
-
Know how long a service is impacted with a formula in an excel report
It is important to know how long the service has been impacted by...