ServiceNow: dashboard to optimize the widget management
A dashboard is a good way to organize and to manage efficiently all charts. I like to create different dashboards for instance, one for SLA, another one for closed tickets, another one for TOP10, etc. Inside each dashboard, I can create different tabs to optimize it better, for example, inside the SLA, I will have 1 tab for incident, 1 tab for problem. To create a dashboard, follow those steps:
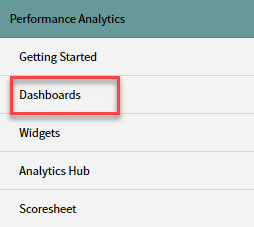
- 1. Go to “performance analytics -> dashboards”

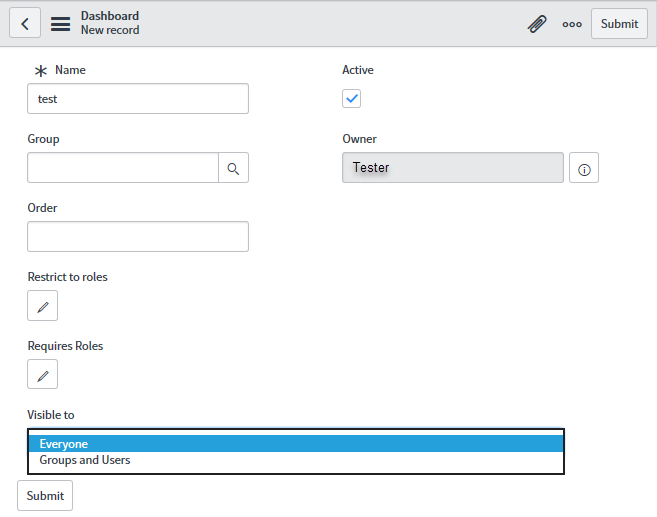
- 2. Click to “new”

a. Name: put a name
b. Group: select a dashboard group
c. Order: put a number to order it
d. Restrict to roles/requires roles: edit rules
e. Visible: select the option
f. Once done, click “submit”

- 3. To delete it
a. Go back to “performance analytics -> dashboards”
b. Search for the dashboard
c. Open it
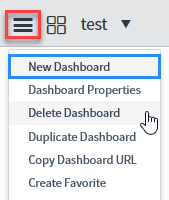
d. Click on “dashboard control” menu
e. Select “delete dashboard”

Now that I have my dashboard, I need to fill it with charts/reports, to do it, read ServiceNow: add reports/charts in the dashboard.
Interesting Management
-

Part 1: A good manager, better team motivation, better team productivity, better team results
When you are managing a team, “how to be a good manager” is the “must”...
-

Report optimization, increase your time management
As manager, I am doing many reports, even when I was an ITIL consultant, I still needed to do many reports...
-

Tools to get your ITIL intermediate certifications, the missing 15 points for the ITIL 4 Managing Professional
ITIL V3 is going to be obsolete...
-

The importance of the first customer meeting for the service
Managing an IT service when I start a new company is not an easy task, particularly true, if the service...


